Lecture 3: Building Blocks for Time Series
Raul Riva
FGV, Brazilian School of Economics and Finance (FGV EPGE)
October 2026
Econometrics I (Part I)
Introduction
Types of Data
Common data structures in Economics:
- Cross-sectional data: many units, one time period
- Grades of several students in one exam, GDP growth of several countries in a given year
- Time series data: one unit, many time periods
- Inflation over time in one country, rainfall in a given area, the price of a stock
- Panel data: many units, many time periods for the same units
- GDP growth of several countries over several years, prices of several products over time
- Text, spatial data, images, etc.
Where We Are
- So far: mostly cross-sectional methods (everything about \(Y_i\))
- Next step: time series methods (everything about \(Y_t\))
- Then: panel data methods (everything about \(Y_{i,t}\)), the most common type today
- Next weeks: the challenges of time series data
- This lecture: how time series differ from cross-sections, plus key definitions
- Main reference: Time Series Analysis, by James Hamilton
- Hansen’s book is a nice but short introduction
What Is a Time Series?
- A time series: observations on one or more variables at equally spaced times
- Example: annual population of a country
- Unlike cross-sectional data, time series data is ordered
- Here, time is discrete: days, months, years…
- Continuous time (e.g., high-frequency finance) is a more advanced topic
Why Should You Care?
- Policy evaluation: every policy takes place over time
- What’s the impact of a reform? Before vs after? Long-lasting effects? Fast die-outs?
- A very important building block for panel data methods
- Forecasting: what could the future look like?
- What will inflation be next month? How many students will enroll next semester?
- How much inventory should a firm hold? Where is deforestation heading?
- Nowcasting: high(er)-frequency monitoring of low-frequency variables
- What is the current state of the economy? How many people are unemployed right now?
- It has very elegant math behind it!
The Role of Dependence
- In cross-sectional data, we typically assume that observations are i.i.d.
- If we relabel observations, we have no problems
- In time series, independence is a rare exception
- Their distribution might also change over time
- If we relabel observations, we change the meaning of the data
Examples:
- If inflation is high this month, it will likely be high next month
- If a student is doing well on every exam, they will likely do well on the next one
- Key difference from cross-sections: the future may depend on the past
Building Blocks
Random Variables
Formally, a time series is a stochastic process. First, what is a random variable?
Definition (Random Variable)
Given a probability space \((\Omega,\mathcal{F},\Pr)\), a random variable is a real function \(Y:\Omega\rightarrow\R\) such that \(\{\omega\in\Omega : Y(\omega)\leq c\}\in\mathcal{F}\) for all \(c\in \R\).
- \(\Omega\) is a sample space. Example: the numbers on a die (1, 2, 3, 4, 5, 6)
- \(\mathcal{F}\) is a collection of events. Example: even numbers
- \(\Pr: \mathcal{F} \to [0,1]\) is a probability measure. Example: probability of rolling an even number
- Think about an i.i.d. sample as different realizations of \(\omega\): \(Y_1 = Y(\omega_1), Y_2 = Y(\omega_2), \dots\)
Stochastic Processes
Definition (Stochastic Process, a Bit Informal)
A stochastic process is an ordered family of random variables \(\{Y_t, t \in \mathcal{T}\}\) defined on a probability space \((\Omega, \mathcal{F}, \Pr)\), where \(\mathcal{T}\) is an ordered set. For a fixed \(\omega \in \Omega\), the path \(\{Y_t(\omega), t \in \mathcal{T}\}\) is one realization of the process.
Loosely speaking:
- A random variable is a way to model an uncertain number
- A stochastic process is a way to model an uncertain path
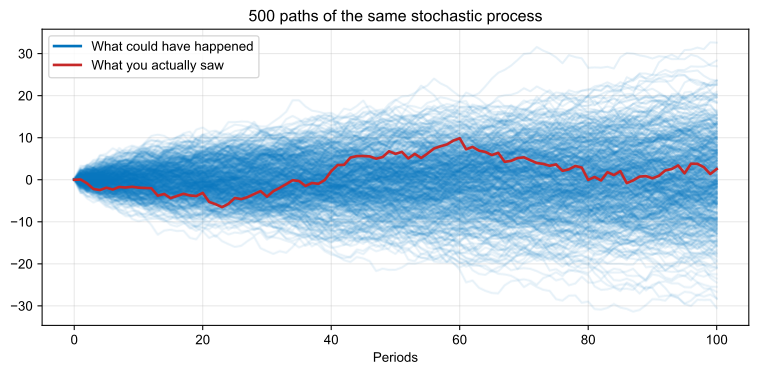
- In reality, we observe one, and only one, realization of the stochastic process
- Think about the history of the world: it is a single realization from \(\Omega\)
- YOLO: you only live once!
YOLO
The Challenge Ahead
- You observe only the red path, but the blue ones were equally likely
- The challenge: you see one path but want to learn about the whole process
Example: inflation in Brazil in 1989
- We know it was super high
- But we have only one reading of inflation for 1989
- When can one observation tell us about Brazil’s “inflation process”?
We need a lot of structure! Without it, we are lost!
Questions?
Stationarity and Ergodicity
Weak Stationarity
Definition (Weak Stationarity)
A stochastic process \(\{Y_t\}\) is weakly stationary (or second-order stationary, or covariance stationary) if, and only if, its first two unconditional population moments exist and are constant over time: \[ \begin{aligned} &\E[Y_t]=\mu, \quad |\mu|<\infty, \quad \forall\, t\in\mathcal{T}\\ &\E[(Y_t-\mu)(Y_{t-h}-\mu)]=\gamma_h, \quad |\gamma_h|<\infty, \quad \forall\, t\in\mathcal{T}, \quad h=0,\pm 1,\pm 2, \ldots \end{aligned} \]
True or false?
- \(\gamma_0 = \Var(Y_t)\)
- \(\gamma_h > \gamma_{-h}\) for \(h \neq 0\)
- An i.i.d. process with finite variance is weakly stationary
What Process Has a Higher \(\gamma_1\)?
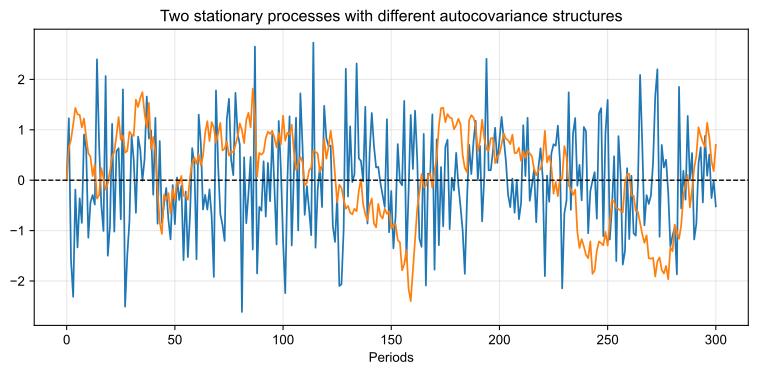
Dial the Persistence
\(Y_t = \rho\, Y_{t-1} + \sqrt{1-\rho^2}\,\varepsilon_t\) with \(\varepsilon_t \iid N(0,1)\). The shocks stay fixed: only \(\rho\) changes
shocks = {
  const draw = d3.randomNormal.source(d3.randomLcg(2141))(0, 1)
  return Float64Array.from({length: 1000}, draw)
}

// Y_0 comes from the stationary law N(0, 1), so the variance is 1 for every rho
persistPath = {
  const y = new Float64Array(shocks.length)
  const s = Math.sqrt(1 - rho * rho)
  y[0] = shocks[0]
  for (let t = 1; t < y.length; t++) y[t] = rho * y[t - 1] + s * shocks[t]
  return Array.from(y, (v, t) => ({t, y: v}))
}

Plot.plot({
  width: 1200, height: 450, marginLeft: 50, marginBottom: 45,
  style: {fontSize: "19px", fontFamily: "Arial, Arimo, sans-serif"},
  x: {label: "Periods", labelAnchor: "center", labelArrow: "none"},
  y: {label: null, domain: [-4, 4], ticks: 5},
  grid: true,
  marks: [
    Plot.ruleY([0], {stroke: "black", strokeDasharray: "5,4"}),
    Plot.line(persistPath, {x: "t", y: "y", stroke: "#0072BC", strokeWidth: 1.3, clip: true})
  ]
})
Strong (or Strict) Stationarity
Definition (Strong Stationarity)
A stochastic process \(\{Y_t\}\) is strongly stationary (or strictly stationary) if, and only if, its joint distributions are invariant to time shifts: for every \(n\), every \(t_1, \dots, t_n\) and every \(\tau\), \[ F_{t_1,\ldots,t_n}(y_1,\ldots,y_n)=F_{t_1+\tau,\ldots,t_n+\tau}(y_1,\ldots,y_n) \quad \forall\, (y_1, \ldots, y_n) \] where \(F_{t_1,\ldots,t_n}\) is the joint CDF of \((Y_{t_1},\ldots,Y_{t_n})\).
True or false?
- If a process is weakly stationary, it is also strongly stationary
- If a process is strongly stationary, it is also weakly stationary
- An i.i.d. process with finite variance is strongly stationary
Ergodicity: Motivation
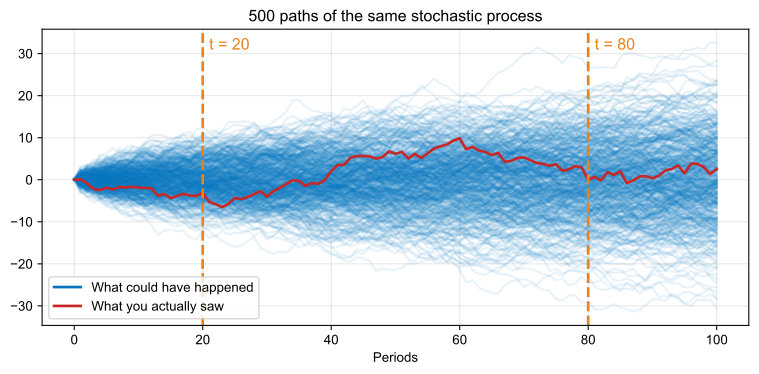
- Let’s call the mysterious process from the YOLO simulation \(m_t\)
- Denote by \(m_t^{(i)}\) the realization of \(m\) at time \(t\) for the \(i\)-th path
- The paths are independent (because I chose so!)
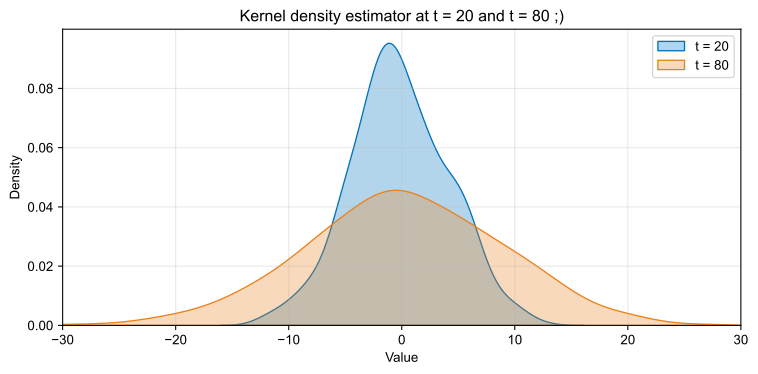
- Goal: estimate two (possibly different) quantities, \(\E[m_{20}]\) and \(\E[m_{80}]\)
- How can I do that?
Ergodicity: Motivation
Ergodicity: Motivation
Ergodicity: Motivation
Proposal 1: estimate \(\E[m_{20}]\) by averaging the values at \(t=20\) across all paths
- Formally: \(\hat{m}_{20} = \frac{1}{n} \sum_{i=1}^{n} m_{20}^{(i)}\), where \(n\) is the number of paths. Same for \(t=80\)
- Would this yield a consistent estimator?
- What’s the main problem with this approach?
Proposal 2: I do not have access to the whole process, so I use the one path I have
- Estimate \(\E[m_{20}]\) by averaging across all time periods in the path: \(\widetilde{m}_{20} = \frac{1}{T} \sum_{t=1}^{T} m_{t}^{(1)}\)
- Would I need stationarity for this to yield a consistent estimator?
- Intuitively, would that be enough?
Example: One Path, Wrong Answer
- A coin is flipped once: \(Z = +2\) (“up”) or \(Z = -2\) (“down”), each with probability \(1/2\)
- Then \(Y_t = Z + \varepsilon_t\), \(\varepsilon_t \iid N(0,1)\) independent of \(Z\): stationary, with \(\E[Y_t] = 0\)
viewof coin = Inputs.form({
  play: Inputs.button("Play", {value: 0, reduce: v => v + 1}),
  flip: Inputs.button("Flip a new coin", {value: 0, reduce: v => v + 1})
}, {template: ({play, flip}) => {
  for (const b of [play, flip]) { b.style.width = "auto"; b.style.margin = "0"; b.querySelector("label")?.remove() }
  return html`<div style="display: flex; justify-content: center; align-items: center; column-gap: 30px; width: 100%; max-width: none">${play}${flip}</div>`
}})
coinT = 500
// One coin flip per click of "Flip a new coin", then T shocks around Z.
// The click count is hashed into the seed: nearby LCG seeds give near-identical first draws
coinSeed = k => {
let x = Math.imul(k ^ (k >>> 16), 0x85ebca6b)
x = Math.imul(x ^ (x >>> 13), 0xc2b2ae35)
return ((x ^ (x >>> 16)) >>> 0) / 4294967296
}
coinPath = {
const rng = d3.randomLcg(coinSeed(2227 + coin.flip))
const draw = d3.randomNormal.source(rng)(0, 1)
const Z = rng() < 0.5 ? 2 : -2
let sum = 0
const rows = Array.from({length: coinT}, (_, i) => {
const y = Z + draw()
sum += y
return {t: i + 1, y, avg: sum / (i + 1)}
})
return {Z, rows}
}
// Before any click, show the whole path (also what the print view shows); a click animates it.
// Progress follows the clock (6 s in total), so slow frames skip ahead instead of dragging
coinNow = {
if (coin.play + coin.flip === 0) { yield coinT; return }
const start = performance.now()
while (true) {
const t = Math.min(coinT, Math.max(1, Math.round((performance.now() - start) / 6000 * coinT)))
yield t
if (t === coinT) return
await Promises.delay(16)
}
}
coinShown = coinPath.rows.slice(0, coinNow)
html`<div style="text-align: center; font-size: 24px; margin-top: 10px">
<span style="color: #0072BC; font-weight: bold">the path you see</span> ·
<span style="color: #C62828; font-weight: bold">its time average</span> ·
<span style="color: #EB811B; font-weight: bold">Z = ±2</span> ·
dashed: E[<i>Y<sub>t</sub></i>] = 0
</div>`Plot.plot({
width: 1200, height: 420, marginLeft: 50, marginBottom: 45,
style: {fontSize: "19px", fontFamily: "Arial, Arimo, sans-serif"},
x: {domain: [1, coinT], label: "Periods", labelAnchor: "center", labelArrow: "none"},
y: {domain: [-5.5, 5.5], label: null, ticks: [-4, -2, 0, 2, 4]},
grid: true,
marks: [
Plot.ruleY([-2, 2], {stroke: "#EB811B", strokeDasharray: "3,5", strokeWidth: 2}),
Plot.ruleY([0], {stroke: "black", strokeDasharray: "7,5", strokeWidth: 1.5}),
Plot.line(coinShown, {x: "t", y: "y", stroke: "#0072BC", strokeOpacity: 0.45, strokeWidth: 1.2}),
Plot.line(coinShown, {x: "t", y: "avg", stroke: "#C62828", strokeWidth: 3}),
Plot.text([`coin: ${coinPath.Z > 0 ? "up" : "down"} · time average after ${coinShown.length} periods: ${coinShown.at(-1).avg.toFixed(2)}`],
{frameAnchor: "top-right", dx: -10, dy: 10, fill: "#C62828", fontWeight: "bold", fontSize: 20, stroke: "white", strokeWidth: 6})
]
})Ergodicity: Definition
- Ergodicity is a property that some stochastic processes have
- Intuitive definition (don’t quote me on this):
Definition (Ergodicity, Intuitive)
A stochastic process \(\{Y_t\}\) is ergodic if its realized paths are “rich enough” with probability 1. By “rich enough”, we mean that, with probability 1, it will neither get stuck in a subset of the state space nor fall into cyclic trajectories.
In other words: observe a process for long enough and you learn everything about it
Ergodicity vs Stationarity
- There are ways to test whether a process is stationary. We will get there
- There is no way to test for ergodicity! You have to assume it!
Important:
- When a process is stationary, there are simple conditions that imply ergodicity
- Under ergodicity and strict stationarity, \(\widetilde{m}_{20}\) is consistent!
- This result is called the Ergodic Theorem (Theorem 14.9 in Hansen’s book)
Also important:
- Stationarity does not imply ergodicity (next slide)
- Exercise (problem set): analyze a process that is stationary but not ergodic
Time Averages vs. Ensemble Averages
Two stationary processes, 50 paths each:
- Ergodic: \(Y_t = \varepsilon_t\), \(\varepsilon_t \iid N(0,1)\)
- Not ergodic: \(Y_t = X_t^2\), \(X_t = S\,\varepsilon_t\), \(S^2 \in \{0.5, 1.5\}\) drawn once per path (50/50)
ergo = {
  const rng = d3.randomLcg(126)
  const draw = d3.randomNormal.source(rng)(0, 1)
  const T = 5000
  const grid = Array.from(new Set(d3.range(301).map(j => Math.round(Math.exp(j * Math.log(T) / 300)))))
  return d3.range(50).map(i => {
    const S2 = rng() < 0.5 ? 0.5 : 1.5
    let sum1 = 0, sum2 = 0, k = 0
    const avgs = []
    for (let t = 1; t <= T; t++) {
      const e = draw()
      sum1 += e
      sum2 += e * e
      if (t === grid[k]) { avgs.push({t, m1: sum1 / t, m2: sum2 / t}); k++ }
    }
    return {path: i, S2, avgs}
  })
}

// Left: Y = e, so its time average is that of e. Right: Y = X^2 = S^2 e^2, so its time average is S^2 times that of e^2
ergoRows = ergo.flatMap(p => p.avgs
  .filter(d => d.t <= Tmax)
  .map(d => ({path: p.path, t: d.t, m1: d.m1, m2: p.S2 * d.m2})))

avgPanel = (key, target, domain, title) => html`<div>
  <div style="text-align: center">${title}</div>
  ${Plot.plot({
    width: 590, height: 350, marginLeft: 50, marginBottom: 45,
    style: {fontSize: "18px", fontFamily: "Arial, Arimo, sans-serif"},
    x: {type: "log", domain: [1, Tmax], label: "t (log scale)", labelAnchor: "center", labelArrow: "none"},
    y: {label: null, domain, ticks: 5},
    grid: true,
    marks: [
      Plot.ruleY([target], {stroke: "black", strokeDasharray: "7,5", strokeWidth: 1.5}),
      Plot.line(ergoRows.filter(d => d.path > 0), {x: "t", y: key, z: "path", stroke: "#0072BC", strokeOpacity: 0.3, strokeWidth: 1.3, clip: true}),
      Plot.line(ergoRows.filter(d => d.path === 0), {x: "t", y: key, stroke: "#C62828", strokeWidth: 3, clip: true}),
      Plot.text([`the path you saw: ${ergoRows.filter(d => d.path === 0).at(-1)[key].toFixed(2)}`], {frameAnchor: "top-right", dx: -10, dy: 10, fill: "#C62828", fontWeight: "bold", fontSize: 20, stroke: "white", strokeWidth: 6})
    ]
  })}
</div>`

html`<div style="display: flex; gap: 20px; justify-content: center; font-size: 19px">
${avgPanel("m1", 0, [-1.5, 1.5], html`Time average of ergodic <i>Y<sub>t</sub></i> (dashed: E[<i>Y<sub>t</sub></i>] = 0)`)}
${avgPanel("m2", 1, [0, 3], html`Time average of non-ergodic <i>Y<sub>t</sub></i> (dashed: E[<i>Y<sub>t</sub></i>] = 1)`)}
</div>`
Formal Definition: Ergodicity (Time Allowing)
Trivial Invariant Events
- Let \(G \subset \R^{\infty}\) and let \(\tilde{Y}_t = (\dots, Y_{t-1}, Y_t, Y_{t+1}, \dots)\) be the history of the process
- An event \(A\) has the form \(A = \{\omega \in \Omega : \tilde{Y}_t \in G\}\)
- The \(l\)-th time shift of \(A\) is \(A_l = \{\omega \in \Omega : \tilde{Y}_{t+l} \in G\}\)
- An event \(A\) is called invariant if \(A_l = A\) for all \(l \in \mathbb{Z}\)
- An event \(A\) is called trivial if \(\Pr(A) = 0\) or \(\Pr(A) = 1\)
Definition (Ergodicity)
A process \(Y_t\) is ergodic if every invariant event is trivial.
Example
- Consider the event \(A = \{\sup_{t \in \mathbb{Z}} Y_t \leq 0\}\)
- In words: the process never takes a positive value
- For any \(l\), \(A_l = \{\sup_{t \in \mathbb{Z}} Y_{t+l} \leq 0\}\)
- Is this event invariant?
- Suppose \(Y_t = Z\) for all \(t \in \mathbb{Z}\), where \(Z \sim U[-1, 1]\)
- This means that the process is constant after \(Z\) is drawn
- What’s \(\Pr(A)\) here?
- Is this process ergodic?
One Useful Characterization of Ergodicity
Theorem (Ergodicity, Characterization)
A strictly stationary series \(Y_t \in \R^{m}\) is ergodic if, and only if, for all events \(A\) and \(B\) \[ \lim_{n \rightarrow \infty} \frac{1}{n} \sum_{l=1}^{n} \Pr(A_l \cap B) = \Pr(A) \cdot \Pr(B) \]
- Intuition: as we go back in time, on average, events become nearly independent
Two Useful Theorems
Stationarity + Ergodicity = LLN
- Goal: estimate the means and second moments of a process
- Stationarity + ergodicity is the “right set of assumptions” to do that
Ergodic Theorem (Hayashi, 2000, pp. 101–102)
If \(Y_t\) is strictly stationary and ergodic with \(\E|Y_t| < \infty\), then \[ \bar{Y}_T = \frac{1}{T} \sum_{t=1}^{T} Y_t \xrightarrow{a.s.} \E[Y_t] \quad \text{as} \quad T \rightarrow \infty \] If, also, \(\E[Y_t^2] < \infty\), then \[ \hat{\gamma}_h = \frac{1}{T} \sum_{t=1}^{T-h} (Y_t - \bar{Y}_T)(Y_{t+h} - \bar{Y}_T) \xrightarrow{a.s.} \gamma_h \quad \text{as} \quad T \rightarrow \infty \]
What to Do in Practice?
- Ergodicity cannot be tested. For estimation alone, there is an easier way out:
Theorem (Brockwell and Davis, 1991, Theorem 7.1.1)
If \(Y_t\) is weakly stationary and \(\sum_{h=0}^{\infty} |\gamma_h| < \infty\), then \[ \bar{Y}_T = \frac{1}{T} \sum_{t=1}^{T} Y_t \xrightarrow{L_2} \E[Y_t] \quad \text{as} \quad T \rightarrow \infty \]
- For \(\hat{\gamma}_h \xrightarrow{p} \gamma_h\) we also need fourth moments (Brockwell and Davis, 1991, Prop. 7.3.4)
- Recall: \(L_2\) implies \(\xrightarrow{p}\), but neither \(L_2\) nor a.s. convergence implies the other
Questions?
White Noise and Martingale Difference Sequences
White Noise
- In the cross-section, it’s common to write \(y_i = \alpha + \beta x_i + u_i\) with \(u_i\) i.i.d.
- We need weaker “error terms”: white noise and martingale difference sequences
Definition (White Noise Process)
A sequence of random variables \((\varepsilon_t)_{t \in \mathbb{Z}}\) is a white noise process if:
- \(\E[\varepsilon_t] = 0\) for all \(t\)
- \(\Var(\varepsilon_t) = \sigma^2 < \infty\) for all \(t\)
- \(\Cov(\varepsilon_t, \varepsilon_s) = 0\) for all \(t \neq s\)
In words: uncorrelated random variables with mean zero and constant variance.
Any i.i.d. sequence with mean zero and finite variance is white noise.
Information Sets
- Conditioning on past information is common in economic models and in Econometrics
- The right objects are \(\sigma\)-fields and filtrations, but we skip the measure theory
- Intuitively: the \(\sigma\)-field generated by \((Y_t, Y_{t-1}, \dots)\) collects the possible histories up to \(t\)
- We write \(\mathcal{F}_t = \sigma(Y_t, Y_{t-1}, Y_{t-2}, \dots)\): all information available up to time \(t\)
- Elsewhere in Economics, \(\sigma\)-fields are called information sets
- Example: \(\E[Y_t | \mathcal{F}_{t-1}]\) is the best guess for \(Y_t\) using only this process up to \(t-1\)
Martingale Difference Sequences
Definition (Martingale Difference Sequence)
A sequence of random variables \((\varepsilon_t)_{t \in \mathbb{Z}}\) is a martingale difference sequence (MDS) with respect to the filtration \(\{\mathcal{F}_t\}\) if:
- \(\varepsilon_t\) is adapted to \(\mathcal{F}_t\)
- \(\E|\varepsilon_t| < \infty\) for all \(t\)
- \(\E[\varepsilon_t | \mathcal{F}_{t-1}] = 0\) almost surely for all \(t\)
True or false?
- Every MDS has (unconditional) mean zero
- \(\Cov(\varepsilon_t, \varepsilon_{t+h}) = 0\) for all \(h \neq 0\)
- \(\E[\varepsilon_{t+h} | \mathcal{F}_{t}] = 0\) for all \(h > 0\)
- \(\E[\varepsilon_{t-h} | \mathcal{F}_{t}] = 0\) for all \(h > 0\)
Example
- Let \(u_t\) be an i.i.d. sequence with mean zero and variance \(\sigma^2 < \infty\)
- Define \(v_t = u_t \cdot u_{t-1}\)
- Is this process i.i.d.? Is it an MDS with respect to its natural filtration? Is it white noise?
- Now define \(m_t = u_t + u_{t-1}\cdot u_{t-2}\)
- Is this process i.i.d.? Is it an MDS with respect to its natural filtration? Is it white noise?
The End
References
- Section 2.2 of Econometrics, by Fumio Hayashi (2000)
- Chapter 7 of Time Series: Theory and Methods, by Peter Brockwell and Richard Davis (1991, 2nd ed.)
- Chapters 3 and 4 of Time Series Analysis, by James Hamilton. MDS are covered in Chapter 7
- Chapter 14 of Econometrics, by Bruce Hansen