Lecture 1: Non-Parametric Estimation
Raul Riva
FGV, Brazilian School of Economics and Finance (FGV EPGE)
October 2026
Econometrics I (Part I)
Introduction
Parametric Models
So far, you have concentrated on parametric models: \[ Y_i = g(X_i, \theta) + u_i \] where \(g\) is a known function and \(\theta\) needs to be estimated.
- Example: \(g(X, \theta) = X'\theta\), good old OLS
- But what happens if you don’t know \(g\)?
- If you have a structural model, theory alone might give you \(g\)
- Just assume some \(g\) that looks cute and call it a day?
- We can do better \(\implies\) non-parametric estimation
Motivation
Our goal will be estimating \[ m(x) = \E[Y|X = x] \]
- Examples: expected wage given education, expected returns given exchange rates…
- For now, both \(Y\) and \(X\) are scalars
- The researcher has access to a random sample \(\{(Y_i, X_i)\}_{i=1}^{n}\)
- With OLS, you always assume that \(m(\cdot)\) is an affine function
- Importantly: in OLS, \(\frac{\partial m(x)}{\partial x}\) is a constant
A Quick Simulation
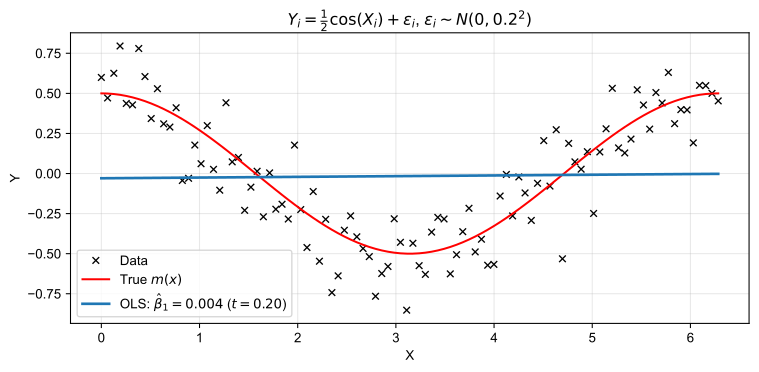
What if \(X\) is discrete?
- Assume that \(X \in \{x_1, x_2, \dots, x_l\}\) for some \(l\). What’s the natural estimator?
\[ \hat{m}(x) = \frac{\sum_{i=1}^{n} I_{\{X_i = x\}}\cdot Y_i}{\sum_{i=1}^n I_{\{X_i = x\}}} \]
- Example: binary \(X\), a treatment
- Exercise: show that this estimator is consistent under mild conditions
- How would you describe this estimator in words?
What about the continuous case?
- Now assume \(X \in \R \implies\) the event \(\{X_i = x\}\) has zero probability
- Well… if \(m(\cdot)\) is continuous, observing points in a neighborhood of \(x\) might be good enough!
- Problem: how large is a neighborhood?
Given \(h>0\) (the bandwidth), the binned estimator is \[ \hat{m}(x) = \frac{ \displaystyle\sum_{i=1}^n I_{\left\{ |X_i - x| \leq h \right\}}\cdot Y_i }{ \displaystyle\sum_{i=1}^n I_{\left\{ |X_i - x| \leq h \right\}} } \]
- What role does \(h\) play here? Small vs large \(h\)?
The Binned Estimator as a Weighted Average
We can also write \[ \hat{m}(x) = \sum_{i=1}^n w_i(x)\cdot Y_i, \qquad w_i(x) \equiv \frac{I_{\left\{ |X_i - x| \leq h \right\}}}{\sum_{j=1}^n I_{\left\{ |X_j - x| \leq h \right\}}} \] where the \(w_i(x)\)’s are weakly positive and \(\sum_{i=1}^n w_i(x) = 1\).
- This estimator is a weighted average of the \(Y_i\)’s, with \(x\)-dependent weights
- True or false: can we interpret these weights as a probability distribution?
- How do these weights change with \(h\)? Smoothly? Sharply?
- One important drawback: the weights change discontinuously with \(h\)!
- \(\hat{m}(x)\) is always a step function, even if \(m(\cdot)\) is continuous!
Kernels
Kernels
- Ideally: points close to \(x\) should matter more for estimation, in a smooth way
- We would like a “continuous way” of measuring distances
- (Continuous) kernels are exactly what we need: they are fancy weights
Definition (Second-Order Kernel)
A second-order kernel function \(K(u)\) satisfies:
- \(0 \leq K(u) \leq \bar{K} < \infty\) \(\implies\) the kernel is non-negative and bounded
- \(K(u) = K(-u)\) \(\implies\) the kernel is symmetric around zero
- \(\int_{-\infty}^{\infty} K(u)\,du = 1\) \(\implies\) like asking the weights to sum to 1
- \(\int_{-\infty}^{\infty}|u|^r K(u)\,du < \infty\) for positive integers \(r\) \(\implies\) “not too fat tails”
Examples
| Kernel | Formula | \(R(K)\) |
|---|---|---|
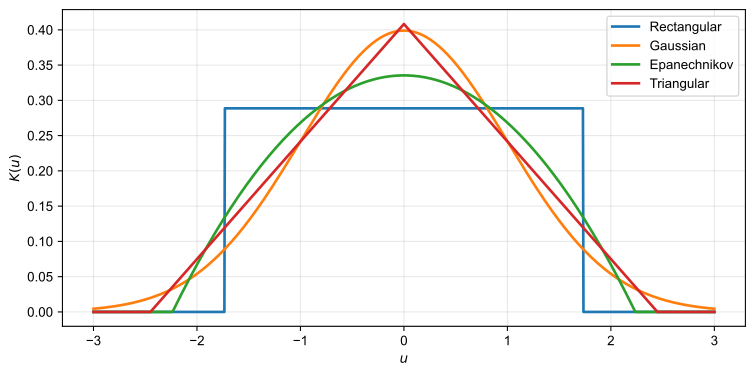
| Rectangular | \(\displaystyle K(u) = \begin{cases} \dfrac{1}{2\sqrt{3}} & \text{if } \lvert u\rvert < \sqrt{3} \\ 0 & \text{otherwise} \end{cases}\) | \(\displaystyle \dfrac{1}{2\sqrt{3}}\) |
| Gaussian | \(\displaystyle K(u) = \frac{1}{\sqrt{2\pi}}\exp\left(-\frac{u^2}{2}\right)\) | \(\displaystyle \frac{1}{2\sqrt{\pi}}\) |
| Epanechnikov | \(\displaystyle K(u) = \begin{cases} \dfrac{3}{4\sqrt{5}}\left(1-\dfrac{u^2}{5}\right) & \text{if } \lvert u\rvert < \sqrt{5} \\ 0 & \text{otherwise} \end{cases}\) | \(\displaystyle \dfrac{3\sqrt{5}}{25}\) |
| Triangular | \(\displaystyle K(u) = \begin{cases} \dfrac{1}{\sqrt{6}}\left(1-\dfrac{\lvert u\rvert}{\sqrt{6}}\right) & \text{if } \lvert u\rvert < \sqrt{6} \\ 0 & \text{otherwise} \end{cases}\) | \(\displaystyle \dfrac{\sqrt{6}}{9}\) |
All four are scaled to have unit variance. \(R(K) \equiv \int K(u)^2\,du\) is the kernel’s roughness (more on it later).
What Do They Look Like?
A More General Estimator
For a given bandwidth \(h>0\), the Nadaraya-Watson (NW) estimator is \[ \hat{m}(x) = \frac{\sum_{i=1}^n K\left(\frac{X_i - x}{h}\right) \cdot Y_i}{\sum_{i=1}^n K\left(\frac{X_i - x}{h}\right)} \]
- Common choices of kernel: Gaussian and Epanechnikov
- Choosing the bandwidth matters more than choosing the kernel
- What happens when \(h \rightarrow 0\)? And when \(h \rightarrow \infty\)?
- Exercise: which kernel gives back the binned estimator?
Pick Your Own \(h\) and \(n\)
viewof h = Inputs.range([0.02, 3], {value: 0.3, step: 0.01, transform: Math.log, label: "Bandwidth h"})
viewof n = Inputs.range([20, 5000], {value: 100, step: 1, transform: Math.log, label: "Sample size n"})
viewof kernel = Inputs.radio(["Gaussian", "Epanechnikov"], {value: "Gaussian", label: "Kernel"})
data = d3.range(n).map(i => {
const x = 2 * Math.PI * i / (n - 1)
const m = 0.5 * Math.cos(x)
return {x, m, y: m + eps_pool[i]}
})
// Unit-variance kernels, as in the table (normalizing constants cancel in NW)
K = kernel === "Gaussian"
? (u => Math.exp(-0.5 * u * u))
: (u => Math.abs(u) < Math.sqrt(5) ? 1 - u * u / 5 : 0)
// Nadaraya-Watson on a grid; 0/0 (no data in the window) leaves a gap
fit = d3.range(301).map(j => {
const x0 = 2 * Math.PI * j / 300
let num = 0, den = 0
for (const d of data) { const w = K((d.x - x0) / h); num += w * d.y; den += w }
return {x: x0, mhat: den > 0 ? num / den : NaN}
})
Plot.plot({
width: 1200, height: 430, marginLeft: 60, marginBottom: 50,
style: {fontSize: "21px", fontFamily: "Arial, Arimo, sans-serif"},
x: {label: "X", labelAnchor: "center", labelArrow: "none"},
y: {label: null, domain: [-1, 1], ticks: 5},
grid: true,
marks: [
Plot.dot(data, {x: "x", y: "y", symbol: "times", stroke: "black",
r: n <= 200 ? 4 : n <= 1000 ? 3 : 2, strokeOpacity: n <= 200 ? 1 : n <= 1000 ? 0.6 : 0.35}),
Plot.line(data, {x: "x", y: "m", stroke: "#C62828", strokeWidth: 2, strokeDasharray: "7,5"}),
Plot.line(fit, {x: "x", y: "mhat", stroke: "#0072BC", strokeWidth: 3}),
Plot.text([`NW fit, h = ${h.toFixed(2)}, n = ${n}`], {frameAnchor: "bottom-right", dx: -10, dy: -38, fill: "#0072BC", fontWeight: "bold", fontSize: 22, stroke: "white", strokeWidth: 6}),
Plot.text(["true m(x)"], {frameAnchor: "bottom-right", dx: -10, dy: -10, fill: "#C62828", fontSize: 22, stroke: "white", strokeWidth: 6})
]
})Questions?
Asymptotic Properties
Does It Work?
- Do we have any guarantees that this methodology works?
- Yes, but flexibility comes with many caveats! Focus on the intuition
Asymptotic setup:
- The sample size \(n \rightarrow \infty\)
- We also need \(h = h(n)\) to converge to zero \(\implies h \rightarrow 0\)
- But not too fast \(\implies n h \rightarrow \infty\)
- Is this intuitive? Why?
- The asymptotic theory is pointwise, i.e., for a fixed value of \(x\)
- The asymptotic distribution of our estimator changes as \(x\) changes
- Very important: we work through the case of an interior point \(x\)
Asymptotic Theory
Write \(Y_i = m(X_i) + U_i\), where \(\E[U_i|X_i] = 0\) and \(\sigma^2(x) \equiv \Var(U_i | X_i = x)\).
Fix \(x \in \R\) and write \(Y_i = m(x) + \left(m(X_i) - m(x)\right) + U_i\).
Then: \[ \begin{aligned} \frac{1}{nh} \sum_{i=1}^n K\left( \frac{X_i - x}{h} \right) Y_i &= \frac{1}{nh} \sum_{i=1}^n K\left( \frac{X_i - x}{h} \right) m(x) \\ &\quad + \underbrace{\frac{1}{nh} \sum_{i=1}^n K\left( \frac{X_i - x}{h} \right) \left(m(X_i) - m(x)\right)}_{\equiv\, \hat{\Delta}_1(x)} \\ &\quad + \underbrace{\frac{1}{nh} \sum_{i=1}^n K\left( \frac{X_i - x}{h} \right) U_i}_{\equiv\, \hat{\Delta}_2(x)} \end{aligned} \]
Asymptotic Theory
- Assume \(X\) has density \(f(\cdot)\), with \(f(x) > 0\)
- Let \(f_n(x) \equiv \frac{1}{nh} \sum_{i=1}^n K\left( \frac{X_i - x}{h} \right)\)
- This is the non-parametric kernel density estimator: a fancy histogram
- Exercise (problem set): show that \(f_n(x) \xrightarrow{p} f(x)\) as \(n\rightarrow \infty\)
- For now, we take this result for granted
- Dividing the previous expression by \(f_n(x)\):
\[ \hat{m}(x) - m(x) = \frac{1}{f_n(x)}\left[\hat{\Delta}_1(x) + \hat{\Delta}_2(x) \right] \]
Asymptotic Theory
We will show that \(\sqrt{nh}\cdot \hat{\Delta}_1(x)\) converges in probability and \(\sqrt{nh}\cdot \hat{\Delta}_2(x)\) has a limiting distribution.
- First, \(\hat{\Delta}_2(x)\). Notice that \[ \E\left[ \frac{1}{nh} \sum_{i=1}^n K\left( \frac{X_i - x}{h} \right) U_i \right] = \frac{1}{h} \E\left[K\left( \frac{X_i - x}{h} \right) U_i\right] = 0 \]
- We also see that \[ \begin{aligned} \Var\left[ \hat{\Delta}_2(x) \right] &= \frac{1}{nh^2} \E \left[ \left( K\left( \frac{X_i - x}{h} \right) U_i \right)^2 \right] = \frac{1}{nh^2} \E \left[ K\left( \frac{X_i - x}{h} \right)^2 \sigma^2(X_i) \right] \\ &= \frac{1}{nh^2} \int_{-\infty}^{\infty} K\left( \frac{z - x}{h} \right)^2 \sigma^2(z) f(z) \, dz \end{aligned} \]
Asymptotic Theory
- Change variables: \(u = \frac{z-x}{h}\)
- We can only do this because \(x\) is in the interior of its support
- The last integral becomes
\[ \frac{1}{nh^2} \int_{-\infty}^{\infty} K\left( \frac{z - x}{h} \right)^2 \sigma^2(z) f(z) \, dz = \frac{1}{nh} \int_{-\infty}^{\infty} K(u)^2\, \sigma^2(x + hu)\, f(x + hu)\, du \]
- Assume that \(\sigma^2(\cdot)\) and \(f(\cdot)\) are continuous
- For any continuous \(g(\cdot)\) and fixed \(u\): \(g(x + hu) = g(x) + o(1)\) as \(h\rightarrow 0\)
\[ \frac{1}{nh} \int_{-\infty}^{\infty} K(u)^2\, \sigma^2(x + hu)\, f(x + hu)\, du = \frac{\sigma^2(x)f(x)}{nh}\int_{-\infty}^{\infty}K(u)^2\,du + o\left(\frac{1}{nh}\right) \]
Asymptotic Theory
- Define \(R(K)\equiv \int_{-\infty}^{\infty}K(u)^2\,du\), the roughness of the kernel
- We have shown that
\[ \Var\left[ \hat{\Delta}_2(x) \right] = \frac{\sigma^2(x)f(x)R(K)}{nh} + o\left(\frac{1}{nh}\right) \]
- Important: the variance of this term only vanishes if \(nh \rightarrow \infty\)
- Fast \(h \rightarrow 0 \implies\) slow convergence of this variance to zero
- By the Lindeberg-Feller CLT:
\[ \sqrt{nh}\,\hat{\Delta}_2(x) \xrightarrow{d} N\left(0, \sigma^2(x)f(x)R(K)\right) \]
- Notice how the asymptotic variance depends on \(x\)!
Asymptotic Theory
Now the other guy, \(\hat{\Delta}_1(x)\), using similar tricks: \[ \begin{aligned} \E[\hat{\Delta}_1(x)] &= \frac{1}{h} \, \E \left[ K\left( \frac{X_i - x}{h} \right) \left( m(X_i) - m(x) \right) \right] \\ &= \frac{1}{h} \int_{-\infty}^{\infty} K\left( \frac{z - x}{h} \right) \left( m(z) - m(x) \right) f(z) \, dz \\ &= \int_{-\infty}^{\infty} K(u) \left( m(x + hu) - m(x) \right) f(x + hu) \, du \end{aligned} \]
Add the assumptions \(f \in C^1\) and \(m \in C^2\), and expand: \[ \begin{gathered} m(x + hu) - m(x) = m'(x)hu + \tfrac{1}{2} m''(x) h^2 u^2 + o(h^2)\\ f(x + hu) = f(x) + f'(x)hu + o(h) \end{gathered} \]
Asymptotic Theory
Distribute the terms:
\[ (m(x + hu) - m(x)) \cdot f(x + hu) = m'(x)f(x)hu + m'(x)f'(x)h^2u^2 + \tfrac{1}{2}m''(x)f(x)h^2u^2 + o(h^2) \]
The term linear in \(u\) integrates to zero (symmetric \(K\)), so: \[ \begin{aligned} \E[\hat{\Delta}_1(x)] &= h^2 \left(\int_{-\infty}^{\infty}u^2K(u)\,du\right)\left(m'(x)f'(x) + \tfrac{1}{2}m''(x)f(x)\right) + o(h^2)\\ & = h^2 \kappa_2 f(x) B(x) + o(h^2) \end{aligned} \] where \(B(x) \equiv m'(x)\frac{f'(x)}{f(x)} + \frac{1}{2}m''(x)\) and \(\kappa_2\equiv \int_{-\infty}^{\infty}u^2K(u)\,du\).
Questions: is \(B(x)\) random? How does \(h\) affect \(\E[\hat{\Delta}_1(x)]\)?
Asymptotic Theory
- Computing \(\Var(\hat{\Delta}_1(x))\) is boring
- See Section 19.26 in Hansen’s Econometrics. He shows that
\[ \Var(\hat{\Delta}_1(x)) = o\left(\frac{1}{nh}\right) \]
- This implies \(\Var(\sqrt{nh}\,\hat{\Delta}_1(x)) = o(1)\)
- The main result is that
\[ \sqrt{nh}\left(\hat{\Delta}_1(x) - h^2 \kappa_2 f(x) B(x)\right) \xrightarrow{p} 0 \]
as long as \(nh^5 = O(1)\) (why do we need this?)
Asymptotic Theory: Main Result
See Chapter 19 of Hansen’s Econometrics for all the technical conditions.
Theorem (Asymptotic Distribution of the NW Estimator)
Under regularity conditions, for interior \(x\), \[ \sqrt{nh} \left( \hat{m}(x) - m(x) - h^2 \kappa_2 B(x) \right) \xrightarrow{d} N\left(0, \frac{\sigma^2(x) R(K)}{f(x)} \right) \] where \(B(x) = m'(x)\frac{f'(x)}{f(x)} + \frac{1}{2}m''(x)\).
- Why is the convergence rate \(\sqrt{nh}\) and not just \(\sqrt{n}\)?
- True or false: is there always a finite-sample bias here?
Questions?
Implementation Matters
The Bias-Variance Trade-off
- If \(n\) is very large:
\[ \hat{m}(x) - m(x) \approx N\left(h^2 \kappa_2 B(x), \frac{\sigma^2(x)R(K)}{nh\cdot f(x)}\right) \]
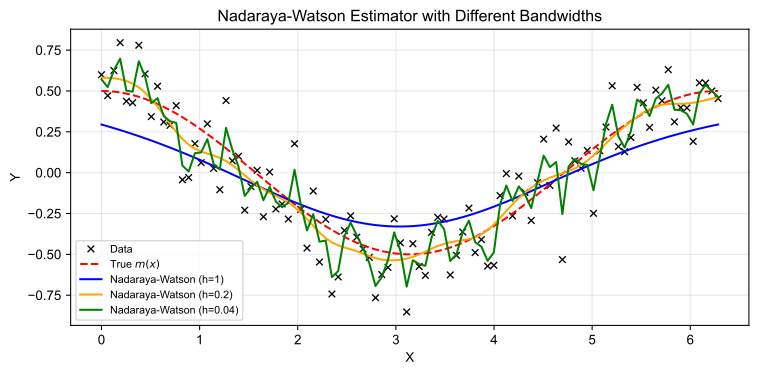
- What is the effect of \(h\) on the mean and on the variance?
- Fundamental trade-off: we can reduce the bias at the expense of variance
- Or you can get low variance… and a huge bias!
- The Epanechnikov kernel minimizes the mean squared error of this estimator across a large class of kernels
- The efficiency loss from the Gaussian kernel is minimal
- Honestly, let the Gaussian kernel be your default in empirical research
How to Pick the Bandwidth?
- The optimal bandwidth depends on moments of the data and derivatives of \(m\)
- Those are unknown in practice
- Ideally, your results should be robust to different bandwidths (within reason)
- A popular way to choose a bandwidth: leave-one-out cross-validation
- Exactly what the Machine Learning literature does!
- See Hansen’s Econometrics for details and the theory behind it
Different Bandwidths
What About the Boundary?
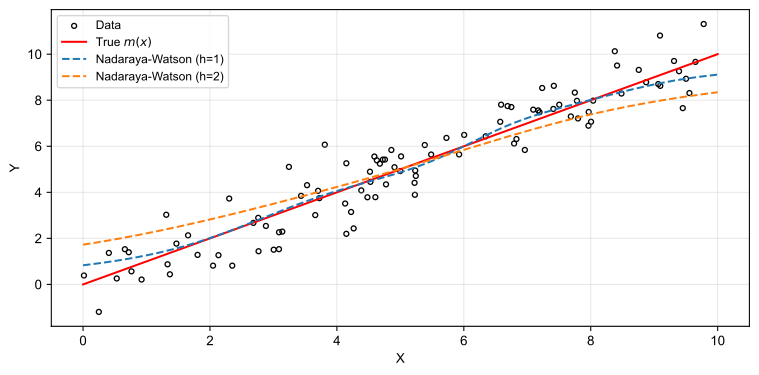
- Suppose \(X_i\) comes from a bounded distribution
- Say \(X \sim U[0,10]\) and \(Y|X = x \sim N(x, 1)\)
The Local Linear Estimator
- The Nadaraya-Watson estimator also solves
\[ \hat{m}(x) = \arg\min_{c \in \R} \sum_{i=1}^{n}K\left(\frac{X_i - x}{h}\right)\cdot (Y_i-c)^2 \]
- That’s why it’s also called the local-constant estimator
- What is stopping us from fitting a linear function here?
Definition (Local-Linear Estimator)
For each \(x\), solve \[ \left(\hat{\beta}_0(x), \hat{\beta}_1(x)\right) = \arg \min_{(b_0, b_1)} \sum_{i=1}^n K\left(\frac{X_i - x}{h}\right)(Y_i - b_0 - b_1(X_i - x))^2 \] The local-linear estimator of \(m(x)\), denoted \(\hat{m}_{LL}(x)\), is the local intercept \(\hat{\beta}_0(x)\).
How Do They Compare?
- Deriving the asymptotic distribution requires similar tricks (see Hansen’s Econometrics)
- Important: both have the same asymptotic variance
- Also important: the bias term of the local-linear estimator is \(h^2 \kappa_2 \frac{m''(x)}{2}\)
\[ \sqrt{nh} \left( \hat{m}_{LL}(x) - m(x) - h^2 \kappa_2 \frac{m''(x)}{2} \right) \xrightarrow{d} N\left(0, \frac{\sigma^2(x) R(K)}{f(x)} \right) \]
- What does this imply if \(m(\cdot)\) is, in fact, linear?
- The local-linear estimator is much better close to the boundary! Why?
Back to the Boundary
- Same data as before: \(X \sim U[0,10]\) and \(Y|X = x \sim N(x, 1)\)
fit_bd = d3.range(201).map(j => {
  const x0 = 10 * j / 200
  let S0 = 0, S1 = 0, S2 = 0, T0 = 0, T1 = 0
  for (let i = 0; i < X_bd.length; i++) {
    const d = X_bd[i] - x0, u = d / h_bd, w = Math.exp(-0.5 * u * u)
    S0 += w; S1 += w * d; S2 += w * d * d; T0 += w * Y_bd[i]; T1 += w * d * Y_bd[i]
  }
  return {x: x0, nw: T0 / S0, ll: (S2 * T0 - S1 * T1) / (S0 * S2 - S1 * S1)}
})

Plot.plot({
  width: 1200, height: 470, marginLeft: 60, marginBottom: 50,
  style: {fontSize: "21px", fontFamily: "Arial, Arimo, sans-serif"},
  x: {label: "X", labelAnchor: "center", labelArrow: "none", domain: [0, 10]},
  y: {label: null, domain: [-2, 12], ticks: 5},
  grid: true,
  marks: [
    Plot.dot(X_bd.map((x, i) => ({x, y: Y_bd[i]})), {x: "x", y: "y", stroke: "black", r: 4, clip: true}),
    Plot.line([{x: 0}, {x: 10}], {x: "x", y: "x", stroke: "#C62828", strokeWidth: 2, strokeDasharray: "7,5"}),
    Plot.line(fit_bd, {x: "x", y: "nw", stroke: "#0072BC", strokeWidth: 3, clip: true}),
    Plot.line(fit_bd, {x: "x", y: "ll", stroke: "#EB811B", strokeWidth: 3, clip: true}),
    Plot.text([`Nadaraya-Watson, h = ${h_bd.toFixed(2)}`], {frameAnchor: "bottom-right", dx: -10, dy: -66, fill: "#0072BC", fontWeight: "bold", fontSize: 22, stroke: "white", strokeWidth: 6}),
    Plot.text([`Local linear, h = ${h_bd.toFixed(2)}`], {frameAnchor: "bottom-right", dx: -10, dy: -38, fill: "#EB811B", fontWeight: "bold", fontSize: 22, stroke: "white", strokeWidth: 6}),
    Plot.text(["true m(x)"], {frameAnchor: "bottom-right", dx: -10, dy: -10, fill: "#C62828", fontSize: 22, stroke: "white", strokeWidth: 6})
  ]
})
Questions?
Curse of Dimensionality
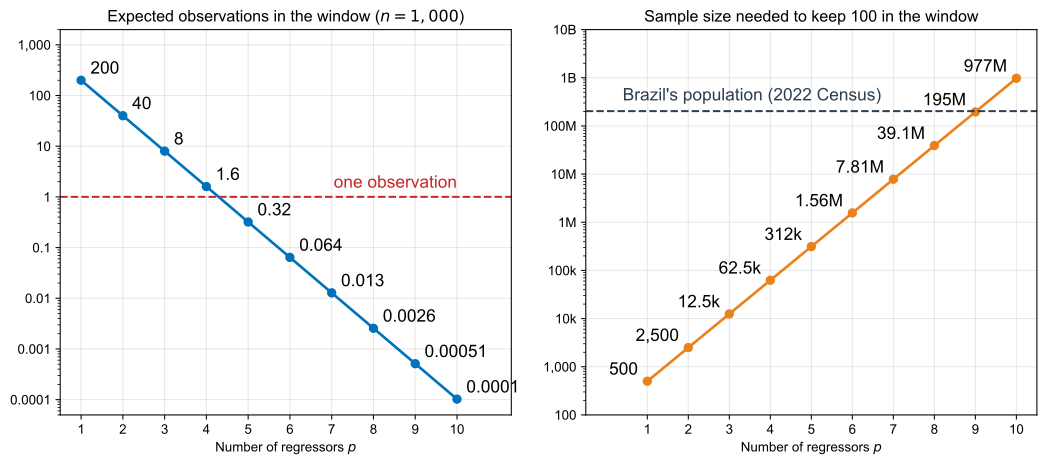
- So far, \(x\) was a scalar. What if \(X_i \in \R^p\) with \(p >1\)?
- Use multivariate kernels and measure “distances” to \(x = (x_1, \dots, x_p)\) as \[ K\left(\frac{X_{i1} - x_1}{h_1}\right)\cdot K\left(\frac{X_{i2} - x_2}{h_2}\right) \cdots K\left(\frac{X_{ip} - x_p}{h_p}\right) \] where \((h_1, \dots, h_p)\) are potentially different bandwidths
- The math gets more involved, but we get the same type of results
- Super important caveat: convergence happens at rate \(\sqrt{n\cdot h_1\cdot h_2 \cdots h_p}\)
- With a common \(h\), we need \(nh^p \rightarrow \infty\). This is very slow
- In practice, if \(p > 4\) you are screwed \(\implies\) open the Machine Learning toolbox
How Fast Does the Neighborhood Empty Out?
\(X \sim U[0,1]^p\), window of half-width \(h = 0.1\): it covers a share \(0.2^p\) of the cube
Confidence Bands
- You did all the math to get the distribution, so you might want to make inference about \(m(x)\)…
- Keep in mind: any confidence band you draw is pointwise
- Usually, we cheat and compute the 95% confidence interval as
\[ \hat{m}(x) \pm 1.96 \cdot \sqrt{\frac{\hat{\sigma}^2(x) R(K)}{nh\, f_n(x)}} \]
where \(\hat{\sigma}^2(x)\) comes from the residuals of your fit, smoothed with the same kernel
- Why is this cheating?
Confidence Bands in Action
band = {
  const n = n_ci, h = h_ci, dx = 2 * Math.PI / (n - 1)
  const RK = 1 / (2 * Math.sqrt(Math.PI))  // R(K) for the Gaussian kernel
  const X = d3.range(n).map(i => i * dx)
  const Y = X.map((x, i) => 0.5 * Math.cos(x) + eps_pool[i])

  // Kernel-weighted average of v at x0 (skipping observation `skip`), and
  // sum_i K((X_i - x0)/h) = n h f_n(x0). X is an even grid, so only visit |u| < 6.
  const smooth = (v, x0, skip = -1) => {
    const lo = Math.max(0, Math.ceil((x0 - 6 * h) / dx))
    const hi = Math.min(n - 1, Math.floor((x0 + 6 * h) / dx))
    let num = 0, den = 0
    for (let i = lo; i <= hi; i++) {
      if (i === skip) continue
      const u = (X[i] - x0) / h, w = Math.exp(-0.5 * u * u)
      num += w * v[i]; den += w
    }
    return {avg: num / den, sumK: den / Math.sqrt(2 * Math.PI)}
  }

  // Squared leave-one-out residuals, smoothed with the same kernel give sigma^2(x)
  const e2 = X.map((x, i) => (Y[i] - smooth(Y, x, i).avg) ** 2)
  const fit = d3.range(301).map(j => {
    const x = 2 * Math.PI * j / 300
    const {avg: mhat, sumK} = smooth(Y, x)
    const se = Math.sqrt(smooth(e2, x).avg * RK / sumK)
    return {x, m: 0.5 * Math.cos(x), mhat, lo: mhat - 1.96 * se, hi: mhat + 1.96 * se}
  })
  const ok = fit.filter(d => d.lo <= d.m && d.m <= d.hi).length
  return {data: X.map((x, i) => ({x, y: Y[i]})), fit, cover: ok / fit.length}
}

Plot.plot({
  width: 1200, height: 450, marginLeft: 60, marginBottom: 50,
  style: {fontSize: "21px", fontFamily: "Arial, Arimo, sans-serif"},
  x: {label: "X", labelAnchor: "center", labelArrow: "none"},
  y: {label: null, domain: [-1, 1], ticks: 5},
  grid: true,
  marks: [
    Plot.dot(band.data, {x: "x", y: "y", symbol: "times", stroke: "black", clip: true,
             r: n_ci <= 200 ? 4 : n_ci <= 1000 ? 3 : 2, strokeOpacity: n_ci <= 200 ? 1 : n_ci <= 1000 ? 0.6 : 0.35}),
    Plot.areaY(band.fit, {x: "x", y1: "lo", y2: "hi", fill: "#0072BC", fillOpacity: 0.25, clip: true}),
    Plot.line(band.fit, {x: "x", y: "m", stroke: "#C62828", strokeWidth: 2, strokeDasharray: "7,5"}),
    Plot.line(band.fit, {x: "x", y: "mhat", stroke: "#0072BC", strokeWidth: 3, clip: true}),
    Plot.text([`NW fit + 95% band, h = ${h_ci.toFixed(2)}, n = ${n_ci}`], {frameAnchor: "bottom-right", dx: -10, dy: -66, fill: "#0072BC", fontWeight: "bold", fontSize: 22, stroke: "white", strokeWidth: 6}),
    Plot.text(["true m(x)"], {frameAnchor: "bottom-right", dx: -10, dy: -38, fill: "#C62828", fontSize: 22, stroke: "white", strokeWidth: 6}),
    Plot.text([`band covers m(x) at ${Math.round(100 * band.cover)}% of points`], {frameAnchor: "bottom-right", dx: -10, dy: -10, fill: "#EB811B", fontWeight: "bold", fontSize: 22, stroke: "white", strokeWidth: 6})
  ]
})
Questions?
References
- Chapter 19 of Econometrics, by Bruce Hansen
- Chapter 17 of Probability and Statistics for Economists, by Bruce Hansen